7 Deadly Sins Test: How to Compare Your Scores
If your 7 deadly sins test shows Pride at 75 and Envy at 70, the five-point gap is easy to calculate. It’s harder to say what it means. Is one result clearly ahead? Is 75 a percentage of something? And can you compare your 75 with a friend’s 75 the way you’d compare two heights?
Start with what each bar represents: a score based on your responses to a small group of statements. The number describes those answers on that quiz. It isn’t a measurement of character, a population percentile, or the percentage of occasions on which you act that way. If you don’t have a profile yet, the 7 deadly sins test has a 21-question quick version and a 70-question full version that cover the same seven categories.
What the seven bars represent
| Bar | Example of what an answer might reflect |
|---|---|
| Pride | You defend your view before hearing someone’s correction. |
| Envy | Someone else’s progress makes you feel as though you’re falling behind. |
| Wrath | You send the sharp reply or keep replaying the argument after it ends. |
| Sloth | You avoid the first step of a task despite having the time and energy to take it. |
| Greed | You keep accumulating options after you have enough for what you planned. |
| Gluttony | You keep watching or scrolling after you meant to stop and the enjoyment has faded. |
| Lust | Attraction makes you hurry something you wanted to take slowly. |
These are everyday interpretations used by Seven Sides, not definitions for every version of a 7 deadly sins quiz. The names come from Christian moral tradition; the chart is an entertainment feature. To understand a result, look for an actual situation behind it. You might be quick to defend yourself at work and open to correction elsewhere. One bar has no way to tell you when or where that difference appears.
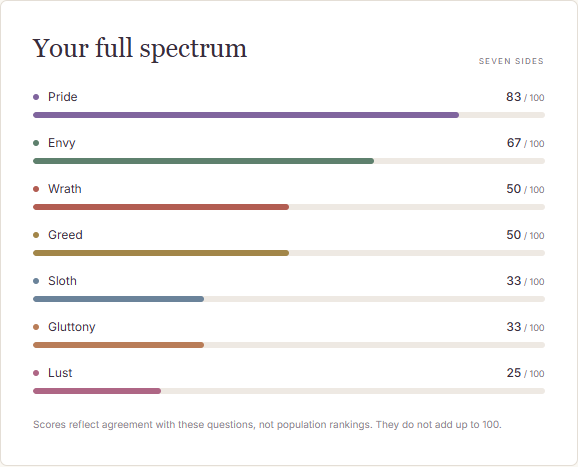
Seven Sides sample profile. Pride is the tallest bar in this example; the other six still have their own scores.
Why the scores don’t add up to 100
The quick 7 deadly sins test groups three statements under each category. The full version has ten per category. For each group, the program puts the five regular choices on a 0–4 scale. A statement phrased in the opposite direction is scored in reverse: a 1 becomes a 3, for example. It averages the usable values and multiplies by 25 to express the result on a 0–100 scale.
Suppose the adjusted values for three Pride statements are 4, 3, and 2. Their average is 3. Multiplying by 25 gives a Pride score of 75. Envy gets its own calculation, as does every other category. An answer marked “doesn’t apply” is omitted rather than counted as a zero. To finish the profile, each category needs at least two usable answers in the quick version or eight in the full version.
That separate calculation is why several bars can be high at once. It’s also why a pie chart would change the meaning of the result: a slice represents a share of one total. Here there is no shared total to divide. Use a row of numbers or bars on the same scale to see what differs.
Compare scores the way you’d compare heights—with one key difference
When you use a height comparison chart, a 190 cm figure and a 180 cm figure share a baseline and a unit. You can place them side by side and see the 10 cm difference. The same layout idea can help with a quiz: keep the bars on a 0–100 scale. The units are quiz points, though. The point difference describes how the answers were scored, not how much more of a habit one person has.
A truncated scale can make a small gap look huge. If you drew bars for 75 and 70 starting at 65, their visible lengths would be 10 and 5. One would look twice as long even though the full scores differ by only five points. Start at zero, end at 100, and label the values so a reader doesn’t have to guess.
Here’s a second example showing how to compare two profiles without ranking the people who took them. The values are fictional and use the same scoring scale.
| Tendency | Profile A | Profile B |
|---|---|---|
| Pride | 75 | 55 |
| Envy | 70 | 50 |
| Wrath | 45 | 75 |
| Sloth | 40 | 65 |
| Greed | 50 | 45 |
| Gluttony | 35 | 55 |
| Lust | 30 | 35 |
Profile A has two close leading scores, Pride and Envy. In Profile B, Wrath is higher than the other categories. That suggests different conversations: A might recall a comparison that made feedback harder to hear; B might think of a time they replied while upset. The scores alone can’t say those situations happened, much less decide who dealt with them better.
If you turn the table into a chart, keep the same category order for both profiles. Sorting both independently makes the tallest bars easy to find but puts different habits on the same row. For a single profile, sorting by score can help you find where to start. For two profiles, matching like with like matters more.
Close results, flat charts, and retakes
Two results are nearly tied. Read both descriptions. Seven Sides can show more than one leading tendency, and results without a strong lead can get a more general heading. A few points are a good reason to compare the underlying questions before you decide what stands out.
The chart is mostly flat. Similar bars don’t mean the quiz failed. You may have answered at about the same level across the categories. Consider whether one question felt more relevant than the title would suggest, or leave it there if none of the labels fit particularly well.
Your scores changed on a retake. If you’re curious, use the same version and think about a similar span of time. The 21- and 70-question formats use different sets of statements. And even on the same version, thinking of a busy workweek instead of a holiday can change how you answer. Read the change as a clue about context before treating it as a change in behavior.
You and a friend want to compare. Choose the same version, keep the scale and row order fixed, and share only what you want to discuss. A useful question for a 7 deadly sins quiz is “What made you think of that answer?” A less useful one is “Who scored worse?”
You can open the 7 deadly sins quiz to see your own profile. Read the numbers together, then keep one example you can describe without the label. “I kept opening another app instead of sending the email” gives you more to think about than “My Sloth bar was 65.”
Related resources
- Seven Sides scoring guide and examples on GitHub — see the walkthrough of adjusted answers, scales, and how to read the whole profile.